Wireshark: Network Protocol Analyzer
In this post, we will use Wireshark to capture the network traffic and observe the initial TCP/IP three-way handshake.
Introduction
Source: wireshark.org
Wireshark is the world’s foremost network protocol analyzer. It lets you see what’s happening on your network at a microscopic level. It is the de facto (and often de jure) standard across many industries and educational institutions.
Features
- Deep inspection of hundreds of protocols, with more being added all the time
- Live capture and offline analysis
- Standard three-pane packet browser
- Multi-platform: Runs on Windows, Linux, OS X, FreeBSD, NetBSD, and many others
- Captured network data can be browsed via a GUI, or via the TTY-mode TShark utility
- The most powerful display filters in the industry
- Rich VoIP analysis
- Read/write many different capture file formats: tcpdump (libpcap), Pcap NG, Catapult DCT2000, Cisco Secure IDS iplog, Microsoft Network Monitor, Network General Sniffer® (compressed and uncompressed), Sniffer® Pro, and NetXray®, Network Instruments Observer, NetScreen snoop, Novell LANalyzer, RADCOM WAN/LAN Analyzer, Shomiti/Finisar Surveyor, Tektronix K12xx, Visual Networks Visual UpTime, WildPackets EtherPeek/TokenPeek/AiroPeek, and many others
- Capture files compressed with gzip can be decompressed on the fly
- Live data can be read from Ethernet, IEEE 802.11, PPP/HDLC, ATM, Bluetooth, USB, Token Ring, Frame Relay, FDDI, and others (depending on your platform)
- Decryption support for many protocols, including IPsec, ISAKMP, Kerberos, SNMPv3, SSL/TLS, WEP, and WPA/WPA2
- Coloring rules can be applied to the packet list for quick, intuitive analysis
- Output can be exported to XML, PostScript®, CSV, or plain text
Let’s Get Started!
- Download and install the Wireshark on your favorite OS virtual machine. Otherwise, it’s already pre-installed in the Kali virtual machine.
- Start the Wireshark network capture on eth0.
- Ping to dz-win10(192.168.56.213) from dz-kali(192.168.56.211).
┌──(kali㉿dz-kali)-[~]
└─$ ping 192.168.56.213
PING 192.168.56.213 (192.168.56.213) 56(84) bytes of data.
64 bytes from 192.168.56.213: icmp_seq=1 ttl=128 time=0.948 ms
64 bytes from 192.168.56.213: icmp_seq=2 ttl=128 time=0.855 ms
64 bytes from 192.168.56.213: icmp_seq=3 ttl=128 time=0.898 ms
^C
--- 192.168.56.213 ping statistics ---
3 packets transmitted, 3 received, 0% packet loss, time 2003ms
rtt min/avg/max/mdev = 0.855/0.900/0.948/0.038 ms
- Download (browse) the webpage at ‘http://192.168.56.213′.
┌──(kali㉿dz-kali)-[~]
└─$ wget http://192.168.56.213
--2024-07-18 12:53:29--  http://192.168.56.213/
Connecting to 192.168.56.213:80... connected.
HTTP request sent, awaiting response... 200 OK
Length: 43 [text/html]
Saving to: ‘index.html’

index.html        100%[================>]      43  --.-KB/s    in 0s

2024-07-18 12:53:29 (2.23 MB/s) - ‘index.html’ saved [43/43]
- Stop the Wireshark network capture on eth0.
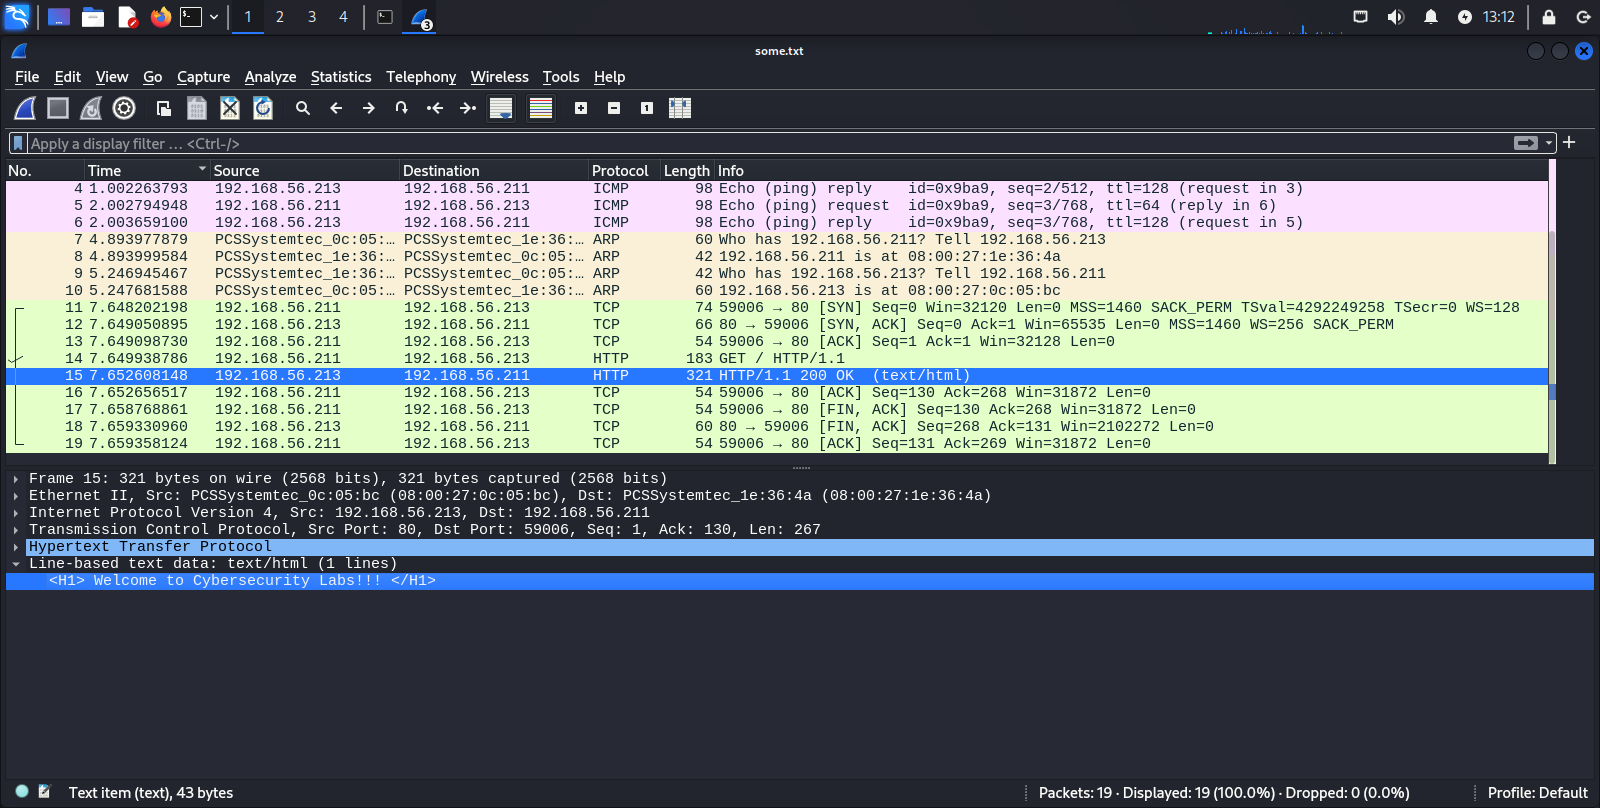
- Did you notice 3 ICMP requests and responses? They correspond to 3 ping requests.
- Filter: ip.proto==ICMP
No.    Time    Source    Destination    Protocol    Length    Info
1    0.000000000    192.168.56.211    192.168.56.213    ICMP    98    Echo (ping) request  id=0x9ba9, seq=1/256, ttl=64 (reply in 2)
2    0.000921831    192.168.56.213    192.168.56.211    ICMP    98    Echo (ping) reply    id=0x9ba9, seq=1/256, ttl=128 (request in 1)
3    1.001443186    192.168.56.211    192.168.56.213    ICMP    98    Echo (ping) request  id=0x9ba9, seq=2/512, ttl=64 (reply in 4)
4    1.002263793    192.168.56.213    192.168.56.211    ICMP    98    Echo (ping) reply    id=0x9ba9, seq=2/512, ttl=128 (request in 3)
5    2.002794948    192.168.56.211    192.168.56.213    ICMP    98    Echo (ping) request  id=0x9ba9, seq=3/768, ttl=64 (reply in 6)
6    2.003659100    192.168.56.213    192.168.56.211    ICMP    98    Echo (ping) reply    id=0x9ba9, seq=3/768, ttl=128 (request in 5)
- Did you notice the TCP/IP three-way handshake?
- Sequence: SYN then SYN, ACK then ACK
- Filter: tcp.flags.syn==1 || tcp.flags.ack==1
No.    Time    Source    Destination    Protocol    Length    Info
11    7.648202198    192.168.56.211    192.168.56.213    TCP    74    59006 → 80 [SYN] Seq=0 Win=32120 Len=0 MSS=1460 SACK_PERM TSval=4292249258 TSecr=0 WS=128
12    7.649050895    192.168.56.213    192.168.56.211    TCP    66    80 → 59006 [SYN, ACK] Seq=0 Ack=1 Win=65535 Len=0 MSS=1460 WS=256 SACK_PERM
13    7.649098730    192.168.56.211    192.168.56.213    TCP    54    59006 → 80 [ACK] Seq=1 Ack=1 Win=32128 Len=0
- Were you able to find the OSI Layer Using Wireshark? Click on the frame similar to this.
15 7.652608148 192.168.56.213 192.168.56.211 HTTP 321 HTTP/1.1 200 OK (text/html)
OSI Layer(s)
Source: wikipedia.org
The Open Systems Interconnection (OSI) model is a reference model from the International Organization for Standardization (ISO) that “provides a common basis for the coordination of standards development for the purpose of systems interconnection”. In the OSI reference model, the communications between systems are split into seven different abstraction layers: Physical, Data Link, Network, Transport, Session, Presentation, and Application.
The model partitions the flow of data in a communication system into seven abstraction layers to describe networked communication from the physical implementation of transmitting bits across a communications medium to the highest-level representation of data of a distributed application. Each intermediate layer serves a class of functionality to the layer above it and is served by the layer below it. Classes of functionality are realized in all software development through all standardized communication protocols.
Each layer in the OSI model has well-defined functions, and the methods of each layer communicate and interact with those of the layers immediately above and below as appropriate.
Layer 1: Physical layer
In the screenshot, it starts with the text ‘Frame 15’Layer 2: Data link layer
In the screenshot, it starts with the text ‘Ethernet II’Layer 3: Network layer
In the screenshot, it starts with the text ‘Internet Protocol Version 4’Layer 4: Transport layer
In the screenshot, it starts with the text ‘Transmission Control Protocol’Layer 5: Session layer and Layer 6: Presentation layer
In the screenshot, it starts with the text ‘Hypertext Transfer Protocol’Layer 7: Application layer
In the screenshot, it starts with the text ‘Line-based text data’
Welcome to Cybersecurity Labs!!!
Final Outcome
